
Microsoft SQL Server Reporting Services
Common SSRS Report Tasks
Common page headers and footers
Report (reportname) generated by DOMAIN/User on 02/03/2010 4:51:03 PM
="Report (" & Globals!ReportName & ") generated by " & User!UserID & " on " & Globals.ExecutionTime"Page X of Y
="Page " & Globals!PageNumber & " of " & Globals!TotalPagesIf you have start and end date parameters, and want to display them in your header or footer, with date formatted as MMM dd, YYYY
="Report Details from " & Format(Parameters!StartDate.Value, "MMM dd, yyyy") & " to " & Format(Parameters!EndDate.Value, "MMM dd, yyyy")How to make alternating rows colored
You have to set the expression for the background color to something like:
=IIF(RowNumber("MyDataSet") Mod 2 = 0, Nothing, "LightCyan")How to format negative numbers
Usually I will be asked to put negative numbers in brackets, and to make these numbers red. So here’s the 2 step process:
In the Format property, use this expression. Note there’s no equal sign.
#,##0.00;(#,##0.00)In the Color property, use this expression:
=IIF(Fields!Amount.Value < 0, "Red", "Black")Get today's date
=Today()Pass parameters through the URL
Here's an example. Note that parameter names are case sensitive.
http://server/ReportServer/Pages/ReportViewer.aspx?%2fFolderName%2fReportName&rs:Command=Render&StartDate=1/1/2009&Param2=Valueor
http://server/ReportServer?/FolderName/ReportName&rs:Command=Render&StartDate=2/2/2009&Param2=ValueOther formatting parameters you can pass through the URL:
&rs:Parameters=Collapsed
&rs:Parameters=true
&rs:Parameters=false
&rs:toolbar=false
&rs:format=EXCEL
&rs:format=PDF
&rs:Format=EXCEL&rc:OmitFormulas=true
&rs:StyleSheet=CustomStyle
&rs:ClearSession=true
How to get number of rows in your result set
=CountRows("YourDataSet")How to join selected multi-valued parameter values in a single sring
=InStr(Join(Parameters!which.Value, ", ")How to sort a report that has been exported to Excel
- Open the excel report
- Select all (Ctrl + A)
- Go to Format > Cells
- Uncheck "Merge Cells"
- Click OK to save changes, then retry sort.
How to format date values
Important thing, make sure your value - whether it's a field or a parameter - is a DateTime data type not a String.
=Format(Parameters!Date.Value,"dd-MM-yyyy") --- 15-03-2010

=Format(Parameters!Date.Value,"dd/MM/yyyy") --- 15/03/2010

=Format(Parameters!Date.Value,"MMM-dd-yyyy") --- Mar-15-2010

=Format(Parameters!Date.Value,"MMM-dd-yy") --- Mar-15-10
How to interactively sort multiple columns
Sort your first field, then hold SHIFT, then sort other fields.
Errors
Invalid object name 'sysdatabases'
When you configure SSRS, and in the Database Setup you get "Invalid object name 'sysdatabase'", then this means the account/login you are using to connect to the Report database is set to something other than master.
Solution: Check this login, and set the default database to master.
The latest Service Packs should have fixed this issue already though.
Building a Dashboard in SQL Server Reporting Services
Problem
Your data warehouse is rock solid. You have multiple sets of fantastic reports. Departments utilize their own designated reporting areas, and you've increased productivity and value (ROI on the BI program) by focusing operations on critical areas by offering specialized filters and sorting as well as exception reports.
Great!
But top level executive management still doesn't have a clear picture of what direction the company is going in and can't make the strategic decisions needed to plan into the future. Your voluminous sets of reports look to them like the local telephone directory. They just don't have the time to wade through every report in all the (wonderful) departmental reporting solutions you have created.
Solution
Time for a Dashboard. (Or several).
Before we begin, let's begin with a basic definition of what a dashboard is. I like this one...
"A digital dashboard, also known as an enterprise dashboard or executive dashboard, is a business management tool used to visually ascertain the status (or "health") of a business enterprise via key business indicators. Digital dashboards use visual, at-a-glance displays of data pulled from disparate business systems to provide warnings, action notices, next steps, and summaries of business conditions." -Wikipedia.com
The Hard Part: Determining Content and Audience
The hard parts of building a dashboard are not technical at all. They are determining what key indicators should be presented and figuring out who the audience should be. For that, you need to work with the top level executives (perhaps through your boss and chain of command), on planning what these key indicators should be and who should be allowed to see them.
You may find you have to create one dashboard for executives and another for the rank and file (middle management and low level staff). If that is the case, then so be it. You just need to find out the score (the business requirements) and move on.
In order to determine content, you may have to ask leading questions like:
"If your BI portal could look like the front page of the NY Times, what would you like to see?"
"What are the top 10 metrics that are important to you as an individual and the Executive Management team?"
"For a top level overview, do you prefer charts and graphics, or are you strictly a numbers person?"
"Should we build one dashboard for top level executives and another for all personnel or should everyone see the same thing?"
Trust me on this, getting these answers will take longer than actually building your dashboard.
One more word of advice before we begin. Your dashboard is not your dashboard. It's the company's dashboard. As such, you need to find a high level business owner that will partner with you on it as you develop it. You need to show them your work at several points during the construction process, and make modifications when needed. Consider it a partnership.
The Tools
There are many commercial software products that provide dashboard solutions. I am sure, for the most part, they can add a great deal of value, and add a level of sophistication that is impressive. Consider them something to grow into. Even if you want to start there, you will want to try building your own mini-version, so you will more fully understand the features and functionality to look for in a commercial product. So regardless over whether you are going to "build or buy", this exercise will be useful for everyone.
I will make the assumption that you already have Microsoft SQL Server 2005 in some production worthy flavor (Standard or Enterprise). You also need an instance of Sharepoint running of one of the following: WSS2, WSS3, Sharepoint Portal 2003, MOSS 2007. Installation of Sharepoint and/or Reporting Services either in Sharepoint Integrated mode or Standard (pre SP2) mode will be outside the scope of this article.
Now that we have that out of the way, we have review some the integration features between Reporting Services and Sharepoint. From this point forward I will only be referring to Sharepoint as WSS2 or WSS3. Everything I say about WSS2 also goes for Sharepoint Portal 2003. Equally, WSS3 can be equated with MOSS 2007 in this regard.
If you are using Reporting Services in Native Mode, then you will likely want/need to use Sharepoint WSS2 as your portal/dashbaord. If you are using Sharepoint Integrated mode, by it's very nature you will be using WSS3 (or MOSS 2007).
Is it possible to cross cross these, either entirely or partially? Well yes, especially if you are good with Sharepoint Designer. But that is outside the scope of this article. For this article we will assume that if you are not using Sharepoint Integrated mode of SQL Reporting Services, then you are using WSS2.
Is this a bad thing? No.
Is it worth upgrading? (Ah, the eternal question.) It depends. If you do not have Reporting Services in Sharepoint Integrated mode, then I suggest you at least try it on a test server or virtual machine. It's worth the experience. You need to go through that experience in order the answer the "Is it worth upgrading?" question for yourself.
Native Mode
You need to install the Reporting Services web parts in order to get the Report Explorer web part. I really have no use for the Report Viewer web part, but it gets installed at the same time.
The installation is a little tricky. Follow these instructions which are direct from SQL Server BOL:
Sharepoint Integrated Mode
If you got through the Report Services installation in Integrated Mode, then you don't need to do anything else. I recently saw a very detailed (Word 2007) document on all the installation screens here.
The Sharepoint Dashboard
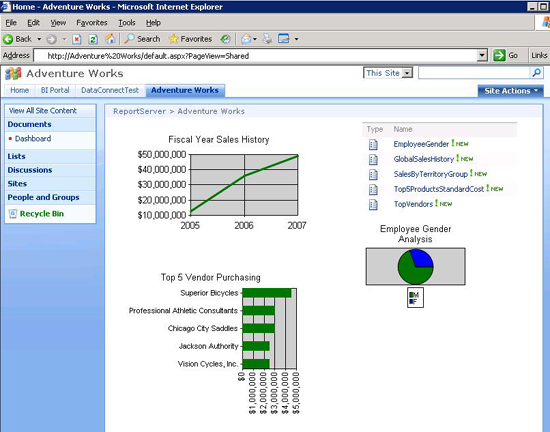
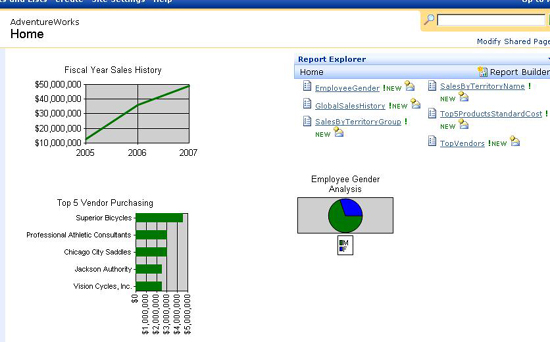
Below is an example of a Dashboard I created against Microsoft's sample Adventure Works database.
The top right report list is a scaled down view of the actual reporting library. The other three objects are actual Reporting Services charts run in real time.
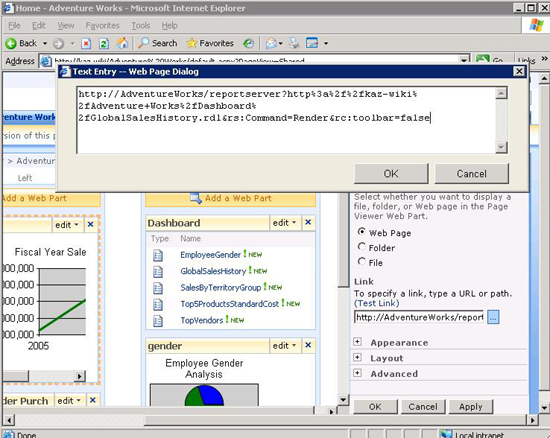
They are displayed using standard Page Viewer Web Part in Sharepoint (not the special Reporting Services web part). I find this much easier and more direct than the Reporting Services web part.
What you don't see is the standard Report Server toolbar. That is because I have hidden it by appending the URL Access Parameter option after the Report Server URL path with the following syntax:
&RC:toolbar=false
In order to use this, you must append it to the Report Server URL path (not the Report Manager or Sharepoint server path). The following is an example of that configuration.
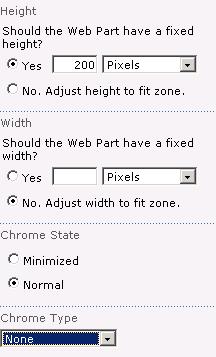
The other options I used were in the Appearance section of the web part. You may need to adjust the default settings for height and width of the web page. Additionally, you will want set the "Chrome Type" to None.
Native Mode
In a WSS2 Sharepoint dashboard you use the Page Viewer Web Page exactly the same way as in the Sharepoint Integrated Mode. Use the Page Viewer Web Part to display your charts and reports opened up.
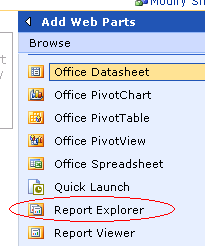
In order to display the Reporting Services library, you cannot use a document library. Instead, you have to use the Reporting Services Report Explorer mentioned above (under "The Tools" section).
Drag the Report Explorer web part to one of the Web Part Zones.
Dashboarding
At this point, we have a single high level web page with various charts and report libraries. In the reports we can add drilldowns and drill-throughs or even links to other sub-level dashboard pages that get narrower in focus. But in Sharepoint, how are we going to create web pages for other dashboards?
Well you could create another site for each sub-level dashboard. And you may want to do that, as your portal scales up. But it is not necessary to do in the beginning or even ever, if you plan carefully.
Here's where you begin:
Instead of a new site, start by creating a new document library. When you create the new document library, you are prompted for a Document template. Change the default type to Web Part Page.
Then start a new page in the document library. When you do, you will be prompted for a web part layout. Choose one that seems appropriate for the dashboard style you want. Then, you can create a new Web Part page for each dashboard you want to build. In WSS2, you cannot apply permissions to each page, so you will to plan your security setup and the functional hierarchy carefully. Perhaps you will need multiple Web Part Page libraries in order to allow for different security boundaries. In WSS3, you can apply security granularity right down to the document level within a single document library so the planning may be a bit different.
Let's Review
Time for a Dashboard. (Or several).
Before we begin, let's begin with a basic definition of what a dashboard is. I like this one...
"A digital dashboard, also known as an enterprise dashboard or executive dashboard, is a business management tool used to visually ascertain the status (or "health") of a business enterprise via key business indicators. Digital dashboards use visual, at-a-glance displays of data pulled from disparate business systems to provide warnings, action notices, next steps, and summaries of business conditions." -Wikipedia.com
The Hard Part: Determining Content and Audience
The hard parts of building a dashboard are not technical at all. They are determining what key indicators should be presented and figuring out who the audience should be. For that, you need to work with the top level executives (perhaps through your boss and chain of command), on planning what these key indicators should be and who should be allowed to see them.
You may find you have to create one dashboard for executives and another for the rank and file (middle management and low level staff). If that is the case, then so be it. You just need to find out the score (the business requirements) and move on.
In order to determine content, you may have to ask leading questions like:
"If your BI portal could look like the front page of the NY Times, what would you like to see?"
"What are the top 10 metrics that are important to you as an individual and the Executive Management team?"
"For a top level overview, do you prefer charts and graphics, or are you strictly a numbers person?"
"Should we build one dashboard for top level executives and another for all personnel or should everyone see the same thing?"
Trust me on this, getting these answers will take longer than actually building your dashboard.
One more word of advice before we begin. Your dashboard is not your dashboard. It's the company's dashboard. As such, you need to find a high level business owner that will partner with you on it as you develop it. You need to show them your work at several points during the construction process, and make modifications when needed. Consider it a partnership.
The Tools
There are many commercial software products that provide dashboard solutions. I am sure, for the most part, they can add a great deal of value, and add a level of sophistication that is impressive. Consider them something to grow into. Even if you want to start there, you will want to try building your own mini-version, so you will more fully understand the features and functionality to look for in a commercial product. So regardless over whether you are going to "build or buy", this exercise will be useful for everyone.
I will make the assumption that you already have Microsoft SQL Server 2005 in some production worthy flavor (Standard or Enterprise). You also need an instance of Sharepoint running of one of the following: WSS2, WSS3, Sharepoint Portal 2003, MOSS 2007. Installation of Sharepoint and/or Reporting Services either in Sharepoint Integrated mode or Standard (pre SP2) mode will be outside the scope of this article.
Checklist: Microsoft SQL Server 2005 (with Reporting Services) Sharepoint (WSS2, WSS3, Sharepoint Portal 2003, or MOSS 2007) |
Now that we have that out of the way, we have review some the integration features between Reporting Services and Sharepoint. From this point forward I will only be referring to Sharepoint as WSS2 or WSS3. Everything I say about WSS2 also goes for Sharepoint Portal 2003. Equally, WSS3 can be equated with MOSS 2007 in this regard.
If you are using Reporting Services in Native Mode, then you will likely want/need to use Sharepoint WSS2 as your portal/dashbaord. If you are using Sharepoint Integrated mode, by it's very nature you will be using WSS3 (or MOSS 2007).
Is it possible to cross cross these, either entirely or partially? Well yes, especially if you are good with Sharepoint Designer. But that is outside the scope of this article. For this article we will assume that if you are not using Sharepoint Integrated mode of SQL Reporting Services, then you are using WSS2.
Is this a bad thing? No.
Is it worth upgrading? (Ah, the eternal question.) It depends. If you do not have Reporting Services in Sharepoint Integrated mode, then I suggest you at least try it on a test server or virtual machine. It's worth the experience. You need to go through that experience in order the answer the "Is it worth upgrading?" question for yourself.
Native Mode
You need to install the Reporting Services web parts in order to get the Report Explorer web part. I really have no use for the Report Viewer web part, but it gets installed at the same time.
The installation is a little tricky. Follow these instructions which are direct from SQL Server BOL:
| 1. Copy the RSWebParts.cab to a folder on the SharePoint server. The .cab is installed with Reporting Services. By default, it is located in the C:\Program Files\Microsoft SQL Server\90\Tools\Reporting Services\SharePoint folder. You can copy it to any folder on the SharePoint server, and then delete it later after you install the Web Parts. 2. On the computer that has the installation of the SharePoint product or technology, open a Command Prompt window and navigate to the folder that has the Stsadm.exe tool. The path will vary depending on which version of Windows SharePoint Services you are running. If you are using Windows SharePoint Services 3.0, the path is C:\Program Files\Common Files\Microsoft Shared\web server extensions\12\BIN. 3. Run Stsadm.exe on the .cab, using the following syntax: STSADM.EXE -o addwppack -filename "C:\ Program Files\Microsoft SQL Server\90\Tools\Reporting Services\SharePoint\RSWebParts.cab" -globalinstall |
Sharepoint Integrated Mode
If you got through the Report Services installation in Integrated Mode, then you don't need to do anything else. I recently saw a very detailed (Word 2007) document on all the installation screens here.
The Sharepoint Dashboard
Below is an example of a Dashboard I created against Microsoft's sample Adventure Works database.
The top right report list is a scaled down view of the actual reporting library. The other three objects are actual Reporting Services charts run in real time.
They are displayed using standard Page Viewer Web Part in Sharepoint (not the special Reporting Services web part). I find this much easier and more direct than the Reporting Services web part.
What you don't see is the standard Report Server toolbar. That is because I have hidden it by appending the URL Access Parameter option after the Report Server URL path with the following syntax:
&RC:toolbar=false
In order to use this, you must append it to the Report Server URL path (not the Report Manager or Sharepoint server path). The following is an example of that configuration.
The other options I used were in the Appearance section of the web part. You may need to adjust the default settings for height and width of the web page. Additionally, you will want set the "Chrome Type" to None.
Native Mode
In a WSS2 Sharepoint dashboard you use the Page Viewer Web Page exactly the same way as in the Sharepoint Integrated Mode. Use the Page Viewer Web Part to display your charts and reports opened up.
In order to display the Reporting Services library, you cannot use a document library. Instead, you have to use the Reporting Services Report Explorer mentioned above (under "The Tools" section).
Drag the Report Explorer web part to one of the Web Part Zones.
- In the configuration of the Report Explorer web part, enter the Report Manager URL (Not the Report Server URL).
I'll digress for a minute here. In Native Mode, the URLs of the Report Server and Report Manager are as follows:
| Native Mode Reporting Servers | Starting URL path |
| Report Manager | http://YourServerName/reports |
| Report Server | http://YourServername/reportserver |
- Enter the Start Path where the reports were deployed. You find this in the Report Designer in the Configuration Manager. (Right click on the solution and select properties.)
- Change the View Mode the List.
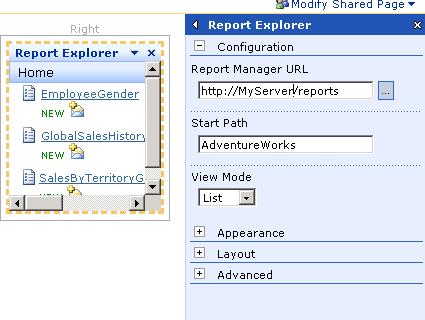
- Here's the WSS2-based dashboard. I'll show the WSS3-based dashboard right below it again so you can see the similarities and differences.
Sharepoint WSS2 (Native Mode) Dashboard example:
Sharepoint WSS3 (Sharepoint Integrated Mode) Dashboard example:
Dashboarding
At this point, we have a single high level web page with various charts and report libraries. In the reports we can add drilldowns and drill-throughs or even links to other sub-level dashboard pages that get narrower in focus. But in Sharepoint, how are we going to create web pages for other dashboards?
Well you could create another site for each sub-level dashboard. And you may want to do that, as your portal scales up. But it is not necessary to do in the beginning or even ever, if you plan carefully.
Here's where you begin:
Instead of a new site, start by creating a new document library. When you create the new document library, you are prompted for a Document template. Change the default type to Web Part Page.
| When creating a document library for additional dashboards, choose theWeb Part Page document template. See screenshots below. | |
| WSS2 | 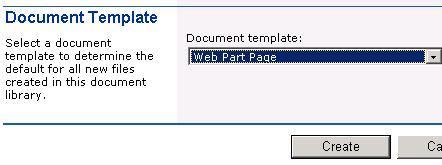 |
| WSS3 | 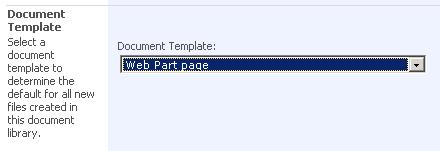 |
Then start a new page in the document library. When you do, you will be prompted for a web part layout. Choose one that seems appropriate for the dashboard style you want. Then, you can create a new Web Part page for each dashboard you want to build. In WSS2, you cannot apply permissions to each page, so you will to plan your security setup and the functional hierarchy carefully. Perhaps you will need multiple Web Part Page libraries in order to allow for different security boundaries. In WSS3, you can apply security granularity right down to the document level within a single document library so the planning may be a bit different.
Let's Review
- Determine the dashboard content and audience by working high level executives to develop your Key Performance Indicators.
- You will need at least one instance of Microsoft SQL Server Reporting Services and one instance of Sharepoint (WSS2 or WSS3).
- Plan your functional areas and security boundaries, and build sites and document libraries accordingly.
- After gathering the business requirements, create several charts, tables, graphs that will depict the key items being measured.
- Lay them out in Web Part Zones on the home page of a Sharepoint site or a Web Part Page, eliminating the toolbar if desired, to minimize screen real estate used.
- Create drill-throughs and links to other sub-level dashboards and reports.
- Before implementing the dashboard solution, stage a demo and get the advice of a couple of top level Executives on content, presentation and security. Let them think about it and get back to you.
__________________________________________________________________________
Controlling dataset processing time in SSRS reports
Problem
Long running queries in complex reports is one key performance optimization area. One way to keep your users from waiting for a long period of time to view a report, due to corrupt queries or poorly designed queries, is to configure your reports with an acceptable time limit to wait for the database engine to return data. In this tip, we will look at how to implement this for SSRS reports.
Solution
We usually want our reports to wait for data for a reasonable period of time, but not indefinitely. There are several ways to create a time limit for your report execution and one of the best ways is to implement a "timeout" limitation on entities that request data from the database engine, i.e. datasets.
Reports generally have two sections where a timeout can be applied - Data Source Connection Timeout and Dataset Timeout. Often developers confuse where to apply the timeout and set it at the connection level. It is valid to set a timeout property on the connection, but in the case where a connection is established in time the query may keep fetching data for a long period of time. This is where we need to apply a time restriction on the dataset.
For an embedded dataset the default timeout is 30 seconds and for a shared dataset the default is no timeout limit. You can read more about this here.
To simulate the problem, follow the below steps:
Step 1
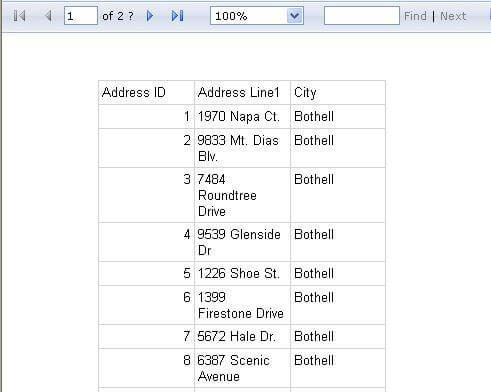
Create a simple SSRS report containing some data. I created a report that looks something like the below screenshot. I am using an embedded dataset in this report, which calls a stored procedure to retrieve data from the database.
STEP 2
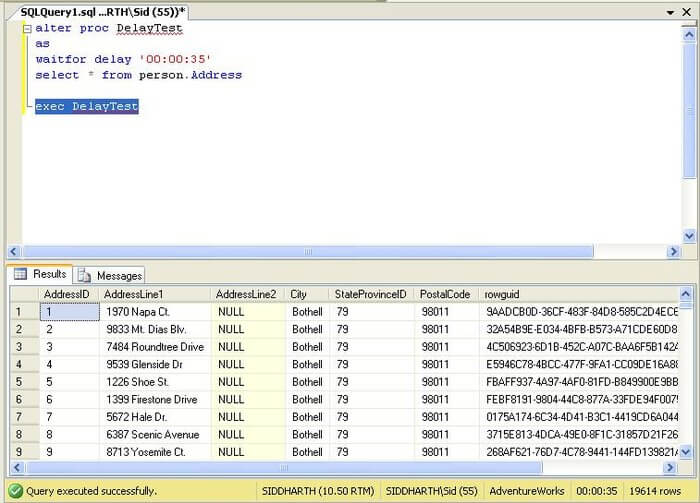
Now to simulate the problem of a long running query. Let's make the stored procedure take more time to complete by adding a WAITFOR DELAY in the stored procedure. Modify the SP as shown in the screenshot below to introduce a delay of 35 seconds.
STEP 3
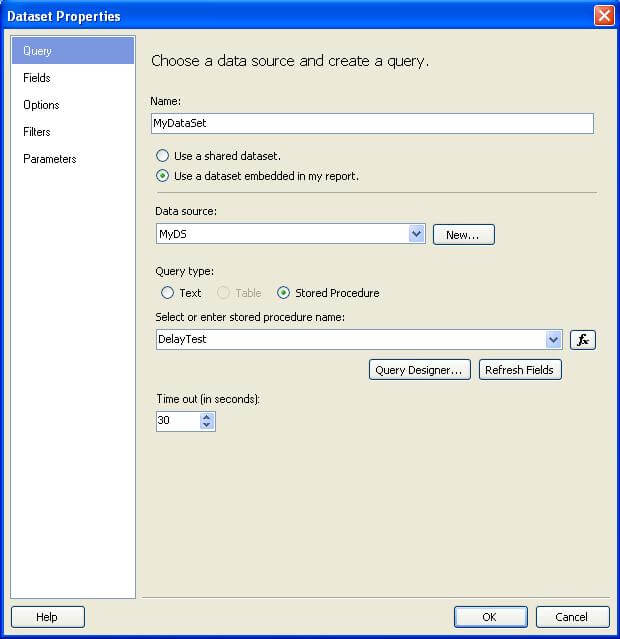
If you go back to the report and check the "timeout" property of the dataset, as shown below, you can see that it is set 30 seconds which is the default timeout period for an embedded dataset.
STEP 4
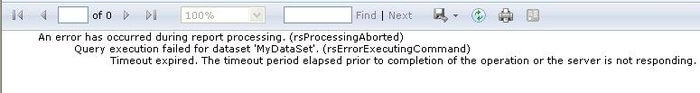
Execute your report using Reports Manager and you will see that after 30 seconds the report will fail with an error as shown in the below screenshot. Although this error formatting is not the best option to show to users, it's better than having them wait indefinitely.
As you can probably tell, the dataset processing was terminated since the data retrieval took longer than the timeout value that was set for the dataset.
Summary
As you can see you have the ability to set the timeout limits for a query. This will allow you to either increase the value for an embedded dataset or set a value for a shared dataset. This way you can better control the user experience instead of queries not finishing in time or taking way too long.
Ideally you should measure the average amount of time a query takes to retrieve results and tune your query response and timeout property to work in optimal harmony. For complex and long running queries you will need to set this value appropriately, so the report does not run forever, but also has enough time to complete the query.
__________________________________________________________________________
Some important SSRS Expressions :
1 - Date formatting
If you have a string parameter coming in to your report (from a stored procedure for example) and need it displayed nicely, try using the expression:
=CDate(Fields!MeetingDate.Value).ToString("dd/MM/yyyy")
You will get minimum date values being displayed if the date is null for particular search criteria. If this is a problem for you, try using:
=IIF(IsDate(Fields!MeetingDate.Value),CDate(Fields!MeetingDate.Value).ToString("dd/MM/yyyy"),"")
Obviously in both these cases you can insert whatever format you'd like in place of "dd/MM/yyyy" :)
2 - IIF statement gotcha
Beware of using the IIF statement above - it works beautifully if the string is either null or a valid date but if the string is something like "tomorrow" (or even an empty string) then you will see "#Error" in your report. This is because IIF statements execute both paths when evaluating (they're not lazy enough!) so Reporting Services tries quite hard to convert "tomorrow" to a date and falls over when it can't. If you need to get around this try writing your own function (Report/Report Properties/Code) using more standard .NET IF statements and call it from your expression. Otherwise, just be aware and be careful when using IIF.
3 - Newlines in text boxes
If you're using an expression to build up a paragraph or two of text in a text box and need a new line, use this:
VBCRLF (Visual Basic Carriage Return Line Feed for those who're interested!)
E.g. ="This is line 1" + VBCRLF + "This isn't" will produce:
This is line 1
This isn't
Gotcha: If VBCRLF is the first or last thing in your text box, Reporting Services will ignore it (I have no idea why!). Make sure you put in one extra VBCRLF at the beginning or end if you're using them there.
4 - Checkboxes
I would have thought it would be fairly common to want to display a check box on a report which is checked based on a value in the dataset but it would appear that it's not so common as there is no control provided to handle this. If your client, like mine, really wants a checkbox displayed on a report, you'll need to use wingdings. Yes, you heard right, add a small text box to your report, set the font to wingdings and use something like the following expression:
=iif(Fields!BookingMade.Value = "1",chr(0254),"o")
Feel free to play around with different wingdings characters, but I found these two gave me a nice looking checkbox that stayed the same size whether it was checked or not!
5 - Alternating row colours
Large tables look better and are easier to read if you shade alternate rows. This is easily accomplished by adding the following to the BackgroundColour expression of your detail row (substituting your desired colours of course):
=iif(RowNumber(Nothing) Mod 2, "#eefafd", "White")
I had a situation recently where my client needed alternating row colours but, for a variety of reasons, the rows displayed on the report were all group header rows. Since the RowNumber resets at every group all my rows stayed white. Using the following expression gave me header rows with alternating colours (the IDNumber is what I was grouping on):
=iif(RunningValue(Fields!IDNumber.Value, CountDistinct, nothing) mod 2,"#eefafd","White")